Ready for 2012? – part 4

Ready for 2012? – part 4
This is the 4th in a series of blog posts under the main headline “Ready for 2012?”
It is addressing the #1 headache of any growing Independent Software Vendor: How to estimate, budget and meet revenue targets.
The objective of the blog posts is to outline a 2012 “preparation process” where you end up having a plan and a budget which is a stepping stone to a position as a the global market leader in the future and where the stakeholders are 100% aligned and committed to execute the plan and deliver the numbers for 2012.
The first post was about alignment and identification. The need for having all stakeholders behind the plan.
The second post introduced the concept of organizational health and the need to get important stakeholder involved in the process.
The third post explained how you could actually perform a alignment & identification check.
The revenue challenge
If you have done the alignment & identification check recommended in blog post 3 you have also ranked these 6 sources of economic growth:
- Revenue growth in new markets (A)
- Revenue growth from new customers (B)
- Revenue growth from new products (C)
- Revenue growths from existing customers (D)
- Optimise asset utilization (E)
- Reduce the cost base (F)
Few growing software companies are concerned about E and F (they should be! more about that later). Most are working in a scenario where the lions share of the revenue is to come from a combination of A and B, which also implies C (if you are taking your current product to new customers in a new market (internationalization), these customers will consider you and your product new also = C).
Let’s image that a real big portion of your 2012 revenue is going to come from A, B and “C”. How are you going to make an ambitious yet realistic revenue budget?
Let’s also assume that you need some of the gross margin earned in 1H to fund the revenue generation in 2H. How exposed are you now?
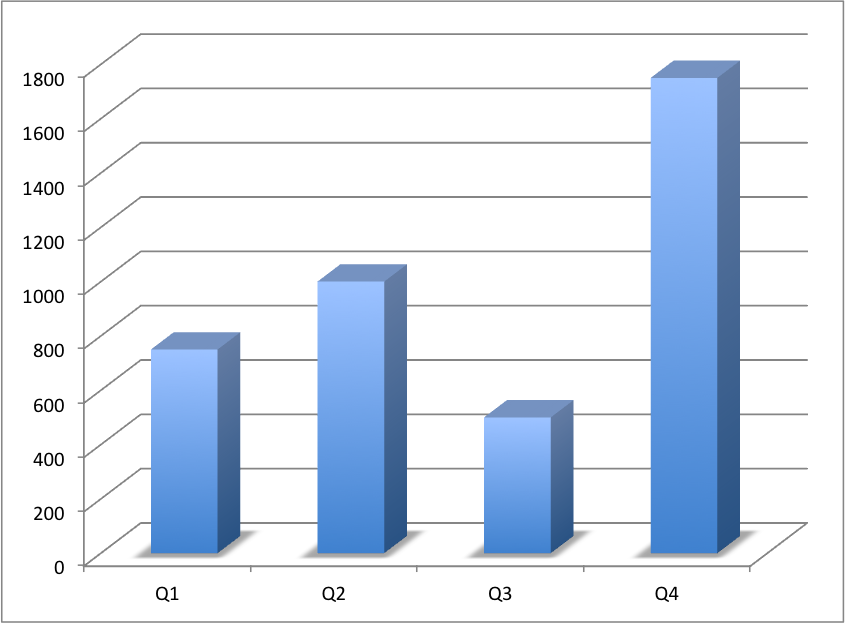
Let’s assume you expect to make a revenue of 2.000 in 2011 and this is 100% more than in 2010. You want to make 4.000 in 2012 (we will discuss if this is sensible in a later post). You probably came out of Q4/2011 with 875 so you are a little cautious for Q1/2012. Q1 is always slower than Q4. Q2 is usually picking up before the holidays. Q3 is a nightmare (in Europe). From end of June to mid September people are on holiday (those who are not have plenty of time = good time for prospecting!). Q4 is hectic, but short (december is Christmas time).
Your revenue budget will look something like this (the famous hockey stick).
You risk being exposed to the illusion of the perspective: The challenges look smaller when they are far away!
Is the main portion of the Q4 target supposed to come from the A-B-C combination?
The revenue model
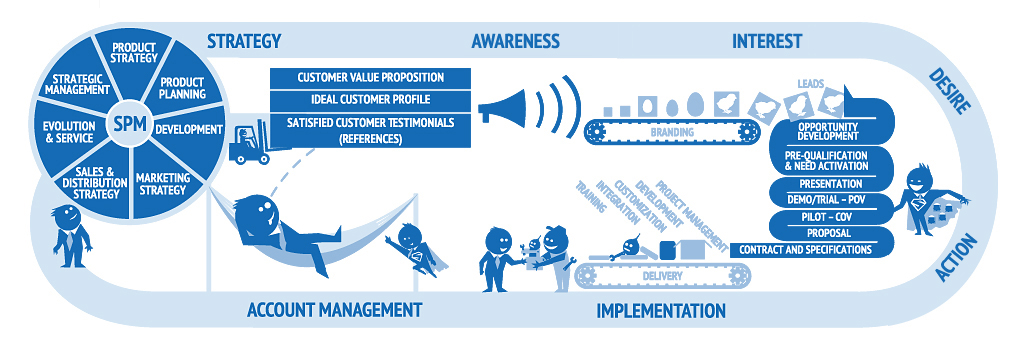
Before you make the final “save” to a budget with a hockey stick revenue profile you must verify the feasibility against a revenue model. A revenue model is a realistic replication of your sales process portion of your value chain – typically in a spreadsheet. It is based on the fundamental metrics of how much time (man and calendar) each step of the marketing/sales/implementation process requires, the size of the average order and your hit rate. The revenue model will calculate the sales and cash you can “produce” with the resources you have available. Provided the new markets and the new customers behave like the current customers!
 Do not forget to add the learning curve if some of the revenue is going to be produced by people you have not hired yet.
You may also want to be more conservative with your revenue model if you are applying it to A-B-C situations, where your knowledge about the new market and the new customers is limited or non-existing.
Improving the process
Now let’s assume that we want market penetration in 2012 to be more productive, thus improving the probability of achieving the 2.000 in Q4. What should we change to make this happen? Order size? Volume of leads? Sharper market segmentation? Sales tools? Shorter sales cycles? (how?), Sales skills? Changes in implementation? Changes in the products?
In order to justify that we can produce more with less we must be able to explain the cause-effect relationships, explain how we will implement the changes, the investment required, the critical success factors of the undertaking and KPI’s telling us if we are achieving the improvements we expected.
Be careful with changing the revenue budget spreadsheet anticipating that things will improve by themselves! Doing so is playing on the “Luck” factor. It’s like playing in the lottery. You may win, but the probability is very very small.
The next post in the “Ready for 2012?” series: The Fundamentals


